Solving Returns with Automation: The Goldilocks Dilemma
Retail ecommerce sales are starting to pick up for most as consumers plan for the Holidays. This has likely left many of you thinking about what you’ll do with returns that may soon be hitting your network. The problem with returns is well documented and continues to be discussed.
While automation helps improve efficiency and reduce the cost of processing returns, the Goldilocks Dilemma comes into play. Too much automation, you lose. Too little automation, you lose. How do you get the automation “just right”? In this piece, we take a look at two very different returns operations and compare the seven operational considerations one needs to examine for returns. We provide a sample formula for calculating ROI and share a glimpse at sample layouts that have made our customers successful.
There is a better way than taking a nap to find answers. It's best to start with a data-driven approach working with an experienced solutions provider, reviewing your operational profile, your needs (See Trew’s blog titled, “Seven Considerations for Returns Automation” for a few things to contemplate), and your facility footprint to lead you down the path of determining the right mix of software, hardware, and labor. We all want just the right number of manual touches in returns processes, so keep in mind they can be minimized using automation coordinated with your RMS (Returns Management Software).
So, what types of automation technologies are in use for returns? Review the following chart, it depicts automation technologies and where they typically fit in returns processing.
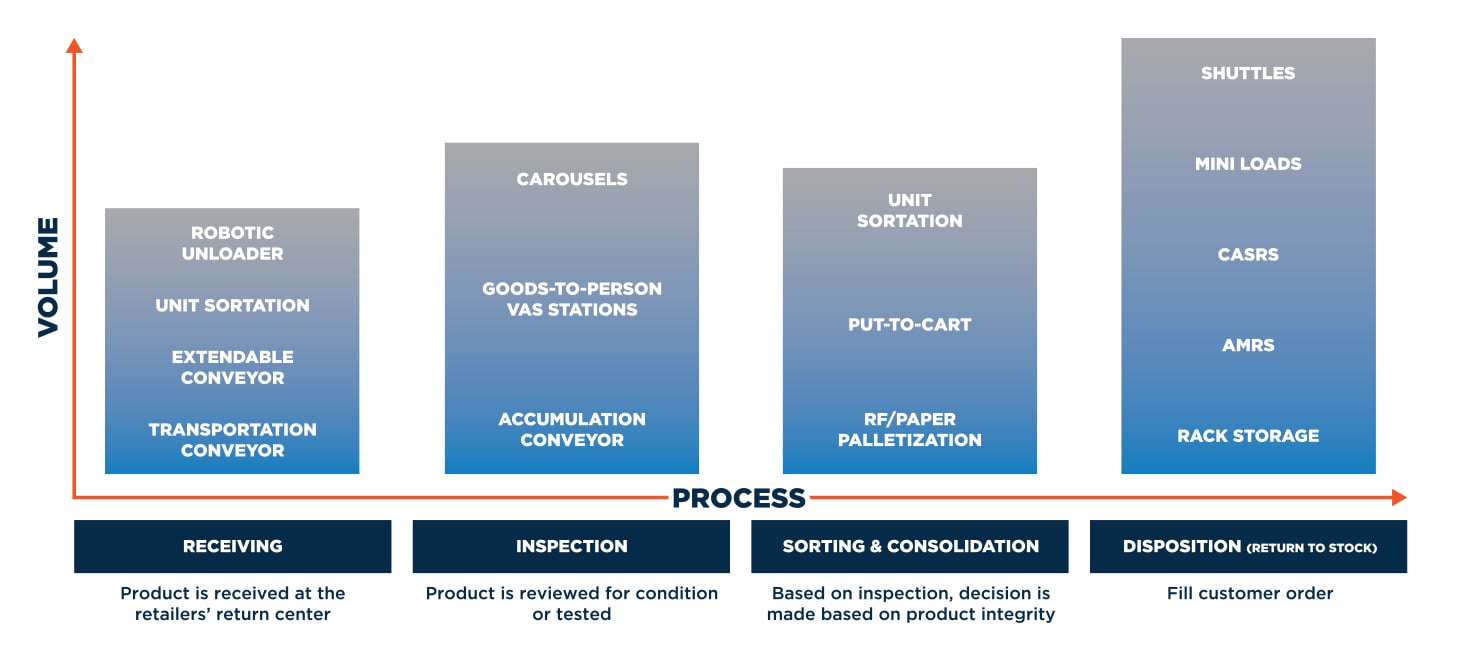
So, what processes within returns operation do you choose to automate and what should you keep as a manual effort? Does it pay to utilize an ASRS to buffer items to consolidate vendor RMAs to reduce shipping costs? Should you use a carousel to store products prior to refurbishment? Will AMRs help with return to inventory efforts?
How do I get things “just right” for my operation?
Your returns process, as well as the scale and investment in automation can vary greatly. A systems integrator can review your operational data and future business projections to compare different automation sets to you determine the ROIs for the various options. A sample ROI formula is shown below. This calculation may look simple, but it is not. The inputs require careful review by data scientists who understand automation, distribution center process flow, and interaction with labor to help work through evaluating which processes provide the highest payback to automate.

Utilizing data modeling scenarios, decisions can be made based on available capital and expected ROI. Using the “Seven Considerations for Returns Automation” and other criteria, below we contrast two sample operations and solution layouts to compare the impact of automation on processes and ROIs.
Comparison based on seven considerations for returns automation:
|
Comparisons |
Lower Volume, Simple Returns Automation |
Higher Volume, More Complex Returns Automation |
| Industry | Fashion Apparel | Home Improvement |
| Time to pickable inventory | Fast fashion requires quick turns to keep up with trends/seasonality | Not as seasonally focused, trends slower to change |
| Automation functions | Production transportation, product sortation | Product transportation, storage/buffer, product sortation |
| Packaging | Low variation - most are polys, small cartons, shoe boxes | High variation, small items that require toting or large items that are repackaged by consumer |
| Dispositioning | Only 5 choices: rework, repackage, return to inventory, recycle, destroy | Main function is to sort and consolidate for vendor RMA, some return to store, recycle/destroy |
| Peaks & Seasonality | High due to fashion cycles, holiday surge | Lower due to longer home trend cycles, bump in spring/summer |
| Space in DC | Existing building, limited footprint | Greenfield facility, space abundant |
| Labor | Highly competitive labor market | Highly competitive labor market |
| Total cost per piece | Low variation | High variation |
Lower Volume, Simple Returns Automation
The example below shows a lower-volume returns operation with a mix of automation and manual intervention, with a heavy emphasis on getting product back to a sellable state. In this example, the ROI is based on the cost of labor (and expected future costs of labor) vs. the cost per piece for handling items at the expected returns volume, and the speed to get the product back into inventory and available for resell.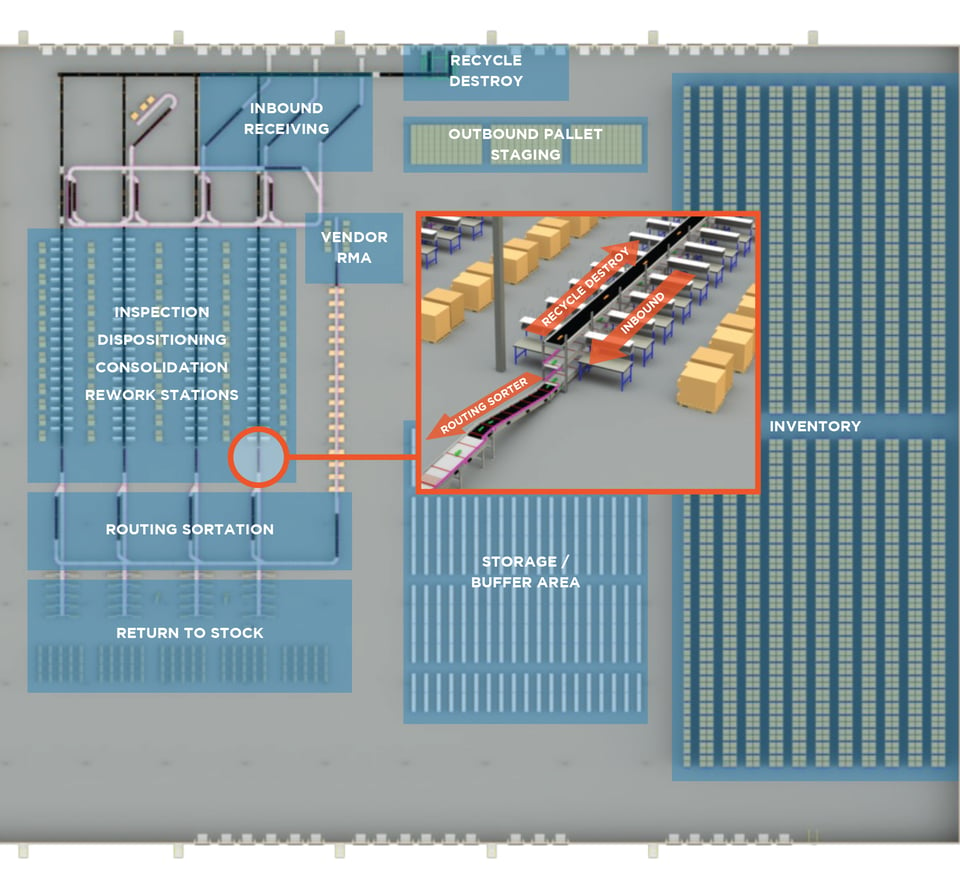
Process for this layout:
-
Product is received, in the case using extendible conveyors that reach into trailers for unloading by hand.
-
Products are taken to disposition inspection stations, where they are manually scanned and reviewed for condition to determine whether to refurbish, repackage/retag/return to inventory, send to a vendor for RMA, recycle or destroy. Due to confined space available, stacked conveyor is used to optimize footprint needed for the system.
-
Products are placed on conveyor and routed to the appropriate locations. The flow shows product being sent to Recycle / Destroy destinations, or to the Routing Sortation.
-
Product at the Routing Sorter are directed to a Return to Stock location where it is put on a cart to be return to inventory, sent to the RMA are for vendor consolidation before shipping back to a specific vendor, or to be repackage for a customer order and sent to shipping.
The resulting ROI:
-
Product flow optimized within footprint, reducing time to inventory turn, and increasing accuracy
-
Labor costs reduced, allowing substantial cost savings
-
Improved time to sellable inventory resulting in higher profit margin and quicker product to cash
Higher Volume, More Complex Returns Automation
The next solution depicts a layout for higher-volume returns operation. It uses additional automation so manual touches take place at induction, consolidation and sometimes at outbound shipping. The storage and consolidation areas allow the solution to save greatly on the manual handling needed to consolidate products to cost optimization shipping. The layout addresses the highest costs in the operation and can justify investments in technology like cross-belt sortation and/or ASRS.
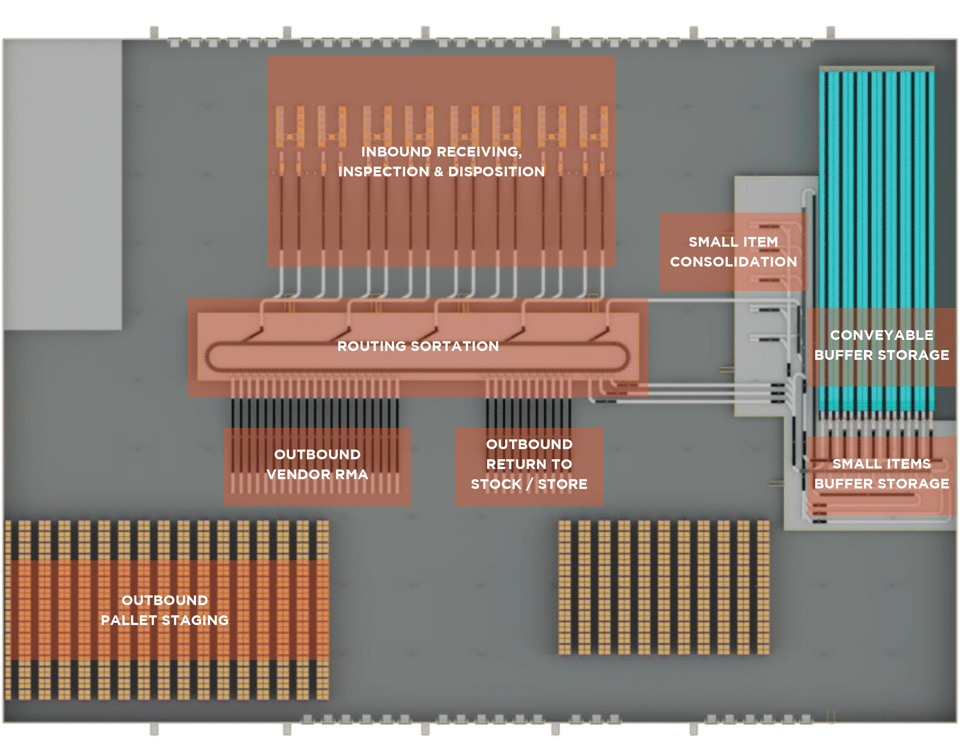
The process for this layout:
-
Products are received, labeled, and inducted into the system. The label acts as a license plate and used by the automation to route to various disposition destinations.
-
A disposition or routing cross-belt sorter, directed by the WES, directs product to its next location. A product may revisit the sorter as it moves through different disposition states.
-
Buffer storage holds products in mini-load and/or shuttle automated storage and retrieval systems (ASRS) to hold items or consolidate them into a single container until it is time to send them to an outbound destination.
-
Disposition lanes are used for operations like return to stock, return to vendor, rework, recycle or destroy where products are processed and palletized or packaged for outbound shipments.
The resulting ROI:
-
Process for product flow is optimized, reducing time to inventory turn, and increasing accuracy
-
Labor costs reduced, allowing substantial cost savings
-
Scalable for expected growth and seasonal spikes; new greenfield built with expansion already in mind
-
Accounts for variation in product/packaging; solution provided for what was normally considered a non-conveyable, reducing labor and waste, reducing handling costs
-
Consolidation enables for high volume return to vendor RMAs, greatly reducing shipping costs
Are there other layouts or technologies to consider for returns? Yes!
A careful review of your operational profile and calculated return on investment is the only way to determine the “just right” solution for returns automation.
So, if you find yourself in a position like Goldilocks, speak with an experienced systems integrator who can help calculate your ROI for returns to help you find the “just right” solution for your operation.


