











 Warehouse automation solutions like AMRs (Autonomous Mobile Robots), ASRS, shuttle systems, and goods-to-person (G2P) technologies are designed to improve picking throughput, reduce labor dependency, and increase accuracy. But they are not one-size-fits-all.
Each solution serves a different operational role depending on factors like order volume, SKU count, space constraints, and fulfillment speed.
In this guide we will demystify trending technologies and finding the best fit solution rather than using a single technology approach.
Table of Contents
-
introduction
-
determining solution fit
-
the recipe for automation success
-
skus
-
orders
-
consumption
-
Understanding Sensitivities (Why Systems Struggle)
-
downloadable guide
Why So Many Options & How Do They Work Together?
Walk into any warehouse automation conversation right now and you’ll hear the same mix of terms: AMRs, ASRS, G2P. It can feel like alphabet soup, and depending on who you ask, every solution sounds like “the answer” with too many teams jumping straight to picking the tools before they understand the fit and constraints.
The Evolution of Warehouse Automation
The industry didn’t get so complicated by accident. Every new solution exists because the previous one had limits.
-
Early person-to-goods AMRs helped workers travel less, but their effectiveness diminished as SKU populations and order volumes increased.
-
Bin-to-person systems emerged bringing inventory directly to operators, followed by shelf-to-person solutions that leverage product affinity to reduce presentations, improving efficiency.
-
As demand continued to grow, shuttle-based systems enabled the delivery of multiple totes simultaneously, supporting larger SKU populations and higher throughput.
-
More recently, dense cube-based ASRS technologies emerged to address the need for high-velocity storage in space-constrained environments.
Each innovation was designed to solve a specific operational challenge, resulting in the wide range of goods-to-person options available today. Every new technology or “ingredient” solves a pain point but also introduces new sensitivities.
How much automation do you really need?
Not everyone needs a shuttle system capable of storing 100,000+ SKUs and processing 700 picks per hour. Think of automation like a recipe. More ingredients don’t always mean a better dish. The key is understanding the right mix: which ingredients (technologies, processes, systems) complement each other to create an exceptional experience. Often, the best ROI comes from organizations making targeted, well informed, time-to-value based improvements.
Struggling to make sense of all of the Goods-to-Person automation choices out there? Not every G2P picking solution is built for the same operation. See how real-world factors impact your solution fit:
Determining the Fit
A right-sized solution aligns with business and operational metrics that create value for your consumers. Before anything else, understand your data because different technologies shine in different conditions.
There are thirteen key points to look at when you start to think about determining a solution fit:
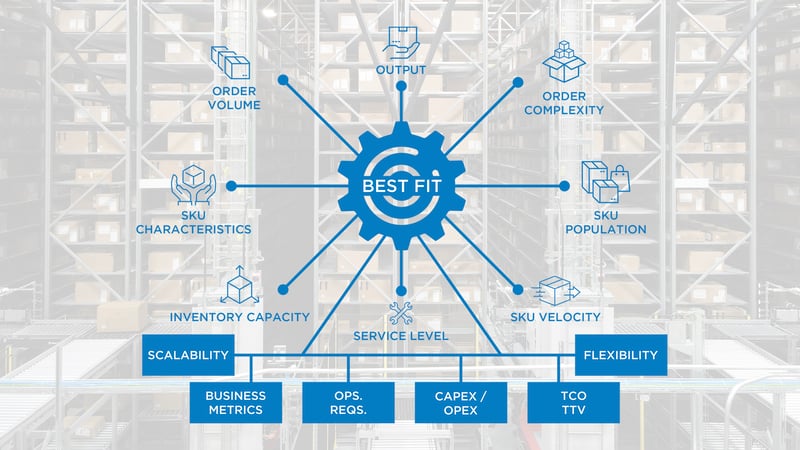
13 Factors That Shape the Automation Recipe
Flexibility / Scalability
By looking at scalability and flexibility, you are able to start seeing the sensitivities of various solutions. Often overused terms, they can indeed be measurable metrics. Once you start evaluating solutions, you can test them against a sliding scale to check their fit.
Flexibility
Warehouse operations always have an ebb and flow. The goal with an automated solution is to try to minimize that variation. When you flex to accommodate variations in demand you sustain the highest system throughput.
Scalability
Scalability speaks to what happens with growth. Tak a look three, five years out to see your SKU and volume growth. Consider how can the technology adapt to the growth and what you need to do to plan for that.
Business metrics
Business metrics allow us to measure whether the solution has hit it’s mark after go-live and ramp up are complete. At some point, the system has to prove itself. Did it deliver:
-
Improved throughput?
-
Cost reductions?
-
Better service levels?
If not, something was misaligned in the design.
operational Requirements
Operational requirements include facility constraints and metrics like units per labor hour or the Perfect Order Index which determine how an automated solution must be engineered.
capex vs opex
Capital Expenditure (CapEx) refers to upfront automation investments like a sorter. Operational Expense (OpEx) refers to ongoing costs to keep the operation running day-to-day, like maintenance and spare parts on a sorter.
total cost of ownership
The upfront purchase is just one piece. Long-term performance, reliability, and efficiency define the true cost. Total Cost of Ownership includes both CapEx and OpEx expenditures.
TCO = Initial investment + Operating costs + Maintenance + Support + End-of-life costs
time to value
Time to Value refers to how long it takes for an automation investment to realize meaningful ROI. Improvements might show up as:
-
Better OTIF (On time in full orders)
-
Faster cycle times
-
Higher accuracy
-
Lower cost per order
The faster that happens, the better the solution fit.
Cost Per Piece
Fulfillment cost can include labor, facility costs, equipment depreciation or lease costs, packaging, overhead, etc. Low-performing networks struggle with high cost across manual touches, excess dwell time, and non-value-added handling at higher units of measure.
Cost per piece = Total fulfillment cost ÷ Total units shipped
inventory capacity
Inventory capacity refers to how much inventory an operation can physically store and effectively process. This can be broken into two layers:
Storage Capacity: How many pallets, totes, or cases can you physically fit. Storage capacity is driven by:
-
Building size
-
Storage system
-
Cube utilization
Operational Capacity: How much inventory can you effectively process. Operational capacity is driven by:
-
Replenishment frequency
-
Picking method
- Software orchestration
service level
An SLA (Service Level Agreement) is a clear promise between two parties defining what will be delivered and how fast. It puts metrics around performance like uptime, response times, or on-time delivery.
output
Output refers to how much an operation produces over a period of time. In the fulfillment world, this refers to orders out the door.
The Recipe for Automation Success
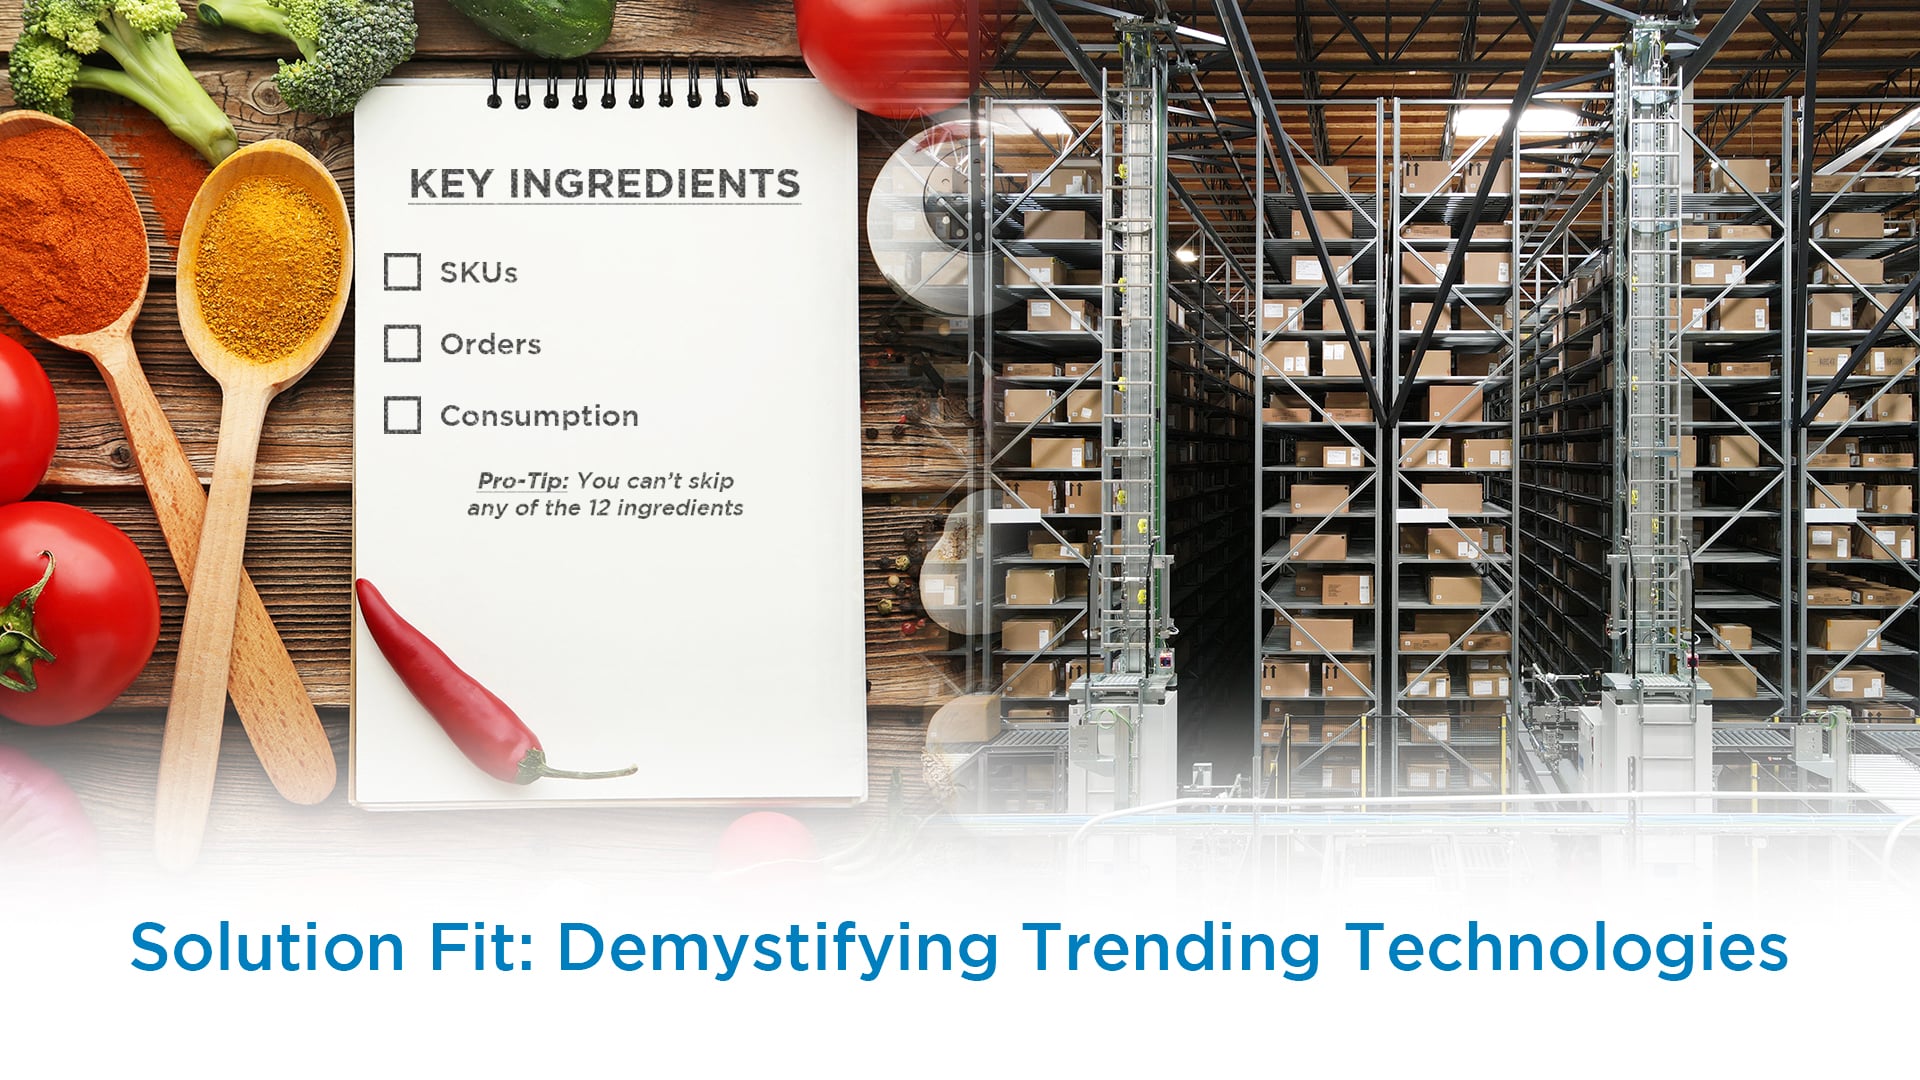
There are three key ingredients in the recipe for a successful automated system:
-
SKUs
-
Orders
-
Consumption
**Pro Tip: You can’t skip any of the ingredients!
skus
A SKU (Stock Keeping Unit) is a unique identifier used to track a specific product variation in inventory. Every meaningful variation of a product (color, size, package quantity) should get its own SKU.
SKU Characteristics
SKU characteristics are the attributes that describe how products behave operationally. They include SKU population, SKU velocity, SKU Pareto distribution, form factors, handling characteristics, SKU affinity, growth patterns, seasonality, and obsolescence.
SKU Population
SKU Population represents the total number of SKUs in an operation.
SKU Population & Person-to-Goods Picking:
Person-to-goods systems work well until SKU populations outgrow product velocity. As SKU counts increase, operators spend more time walking between picks, reducing hit density and overall productivity.
SKU Pareto
A typical SKU pareto is 80-20, meaning that 20% of your SKUs make up 80% of your volume. However, that is not the case for every operation.
SKU Pareto & Cubic ASRS
Cubic ASRS, regardless of vendor, typically functions best at 90-10 pareto due to the nature of their design and the amount of time bin digging factors into the process. They're a good fit at 80-20 pareto but start to become challenged at 70-30 pareto and greater variability.
Here’s why: At 70-30 the system has more slow-moving SKUs that have pick activity. In a cubic system, you have to dig for low velocity SKUs more frequently, slowing the pick rate.
.jpg?width=800&height=376&name=SKU%20Pareto%20Graph%20-%20trew%20(1).jpg)
SKU Velocity
SKU velocity measures how quickly a product (SKU) flows through your warehouse over a given period of time. Think of it as the speed of demand for each item.
-
High velocity SKU = sells frequently and in high volume
- Low velocity SKU = sells infrequently or in small quantities
SKU Velocity & Cube Storage
The pick rate of cube-based storage depends on the accessibility of a robot to every SKU at any given time. If a robot doesn’t have immediate access to a SKU, then there is transition time to get to it. In this situation, a cubic ASRS becomes challenged.
The challenge can be overcome by adding more robots or more time. For example, if order cycle time will allow, you can give a cubic ASRS orders up front so the robots can pre-pick. Then, release the orders an hour or more ahead of time and the robots can retrieve the SKUs that aren’t immediately at the top of the grid and bring them to where they are more accessible.
In some cases, SLAs will allow customers to place orders as late as 4:00pm and still have them shipped by 5:00pm the same day. With ever shortening SLAs like this, there is not an opportunity to pre-pick. Additionally, sometimes operations will experience a 3X – 4X order velocity peak where they can’t control the spike to meet their customer SLAs.
SKU Affinity
SKU affinity measures of how often different products (SKUs) are ordered together on the same order. For example, when someone orders coffee, they probably also order stirrers, coffee filters, and coffee cups.
SKU Affinity in Shelf-to-Person SystemsThe benefit of a shelf-to-person solution in operations where orders have a high SKU affinity is that multiple SKUs are presented to an operator at a time. This allows operators to pick multiple SKUs on the same shelf.When there is low SKU affinity, operators are only picking one SKU on a shelf every time it's presented, the transition time to switch between shelves detracts from the overall pick rate.
orders
Next, let's talk about the impact orders have on the recipe. The main attributes to focus on are volume, cycle time, and complexity.
Order Volume
Order volume is how many customer orders flow through an operation over a given time period: per hour, per shift, per day, or during peak events. Order volume dictates how much demand your operation must absorb. It impacts labor, layout, automation, and ROI. The shape and volatility of volume matter more than averages.
Order Cycle Time
Cycle time is the elapsed time from when an order is released into an operation until it’s ready to ship.
You’ll often hear it called:
-
Order cycle time
-
Order-to-ship time
-
Order-to-delivery (O2D) when transportation is included
Cycle time is a critical operational performance metric because it directly reflects how well people, processes, and automation work together. It impacts SLAs, OTIF (On Time in Full), and productivity. Automation choices should align with cycle time sensitivity.
Order Cycle Time & Bin-to-Person
A word of caution in relation to bin-to-person picking and very short order cycle or service windows: While you can add additional robots to increase pick rates, there's only so much they can do within a given amount of time. If they can't pre-pick, then it is important to look at the order volume that needs to be processed during peak periods, to ensure SLAs can be met.
Order Complexity
Order complexity pertains to how difficult it is to process and fulfill an order. This encompasses order size and structure (many lines per order, how many pieces per line), SKU diversity, unit handling requirements, order variability, and service expectations. Faster delivery expectations compress processing time and raise execution difficulty, while each picking increases effort and cost per order increasing complexity.
Order Complexity & Shuttle Goods-to-Person Systems
As order complexity rises, shuttle-based goods-to-person systems introduce a new challenge: delivering the right items to pick stations in the right sequence.
Once operations reach a certain order velocity, it becomes difficult for products to go from the shuttle to pick stations in a coordinated flow. To make this work, software orchestrates product movement and sequences totes into the order they need to be picked from at the workstation.
At a one-to-one workstation, that pressure is unforgiving; picks must arrive in perfect sequence or be reshuffled at the station to match incoming donor totes to the order in front of the operator, stalling the process. One-to-many stations provide more flexibility, with greater opportunities to buffer and reshuffle.
Consumption
Consumption is about how inventory is used to fulfill orders or consumed. In ecommerce this is driven by customer orders, while in distribution it is driven more by store demand.
Spikes in SKU Velocity
When cubic movement goes to the high side, it may be because velocity increases OR because you have larger items being moved.
What Causes Spikes in SKU Velocity?
You’ve probably seen all of these in the wild. The key is that demand behavior changes faster than the system expects:
-
Promotions / discounts (flash sales, BOGO)
-
Seasonality (holiday gifts, back-to-school)
-
Social / viral demand (that “one product everyone suddenly wants”)
-
Inventory positioning (a SKU gets featured or re-slotted closer to pick faces)
- Channel shifts (store demand → ecommerce demand)
Spikes in SKU Velocity & Shelf-to-Person Solutions
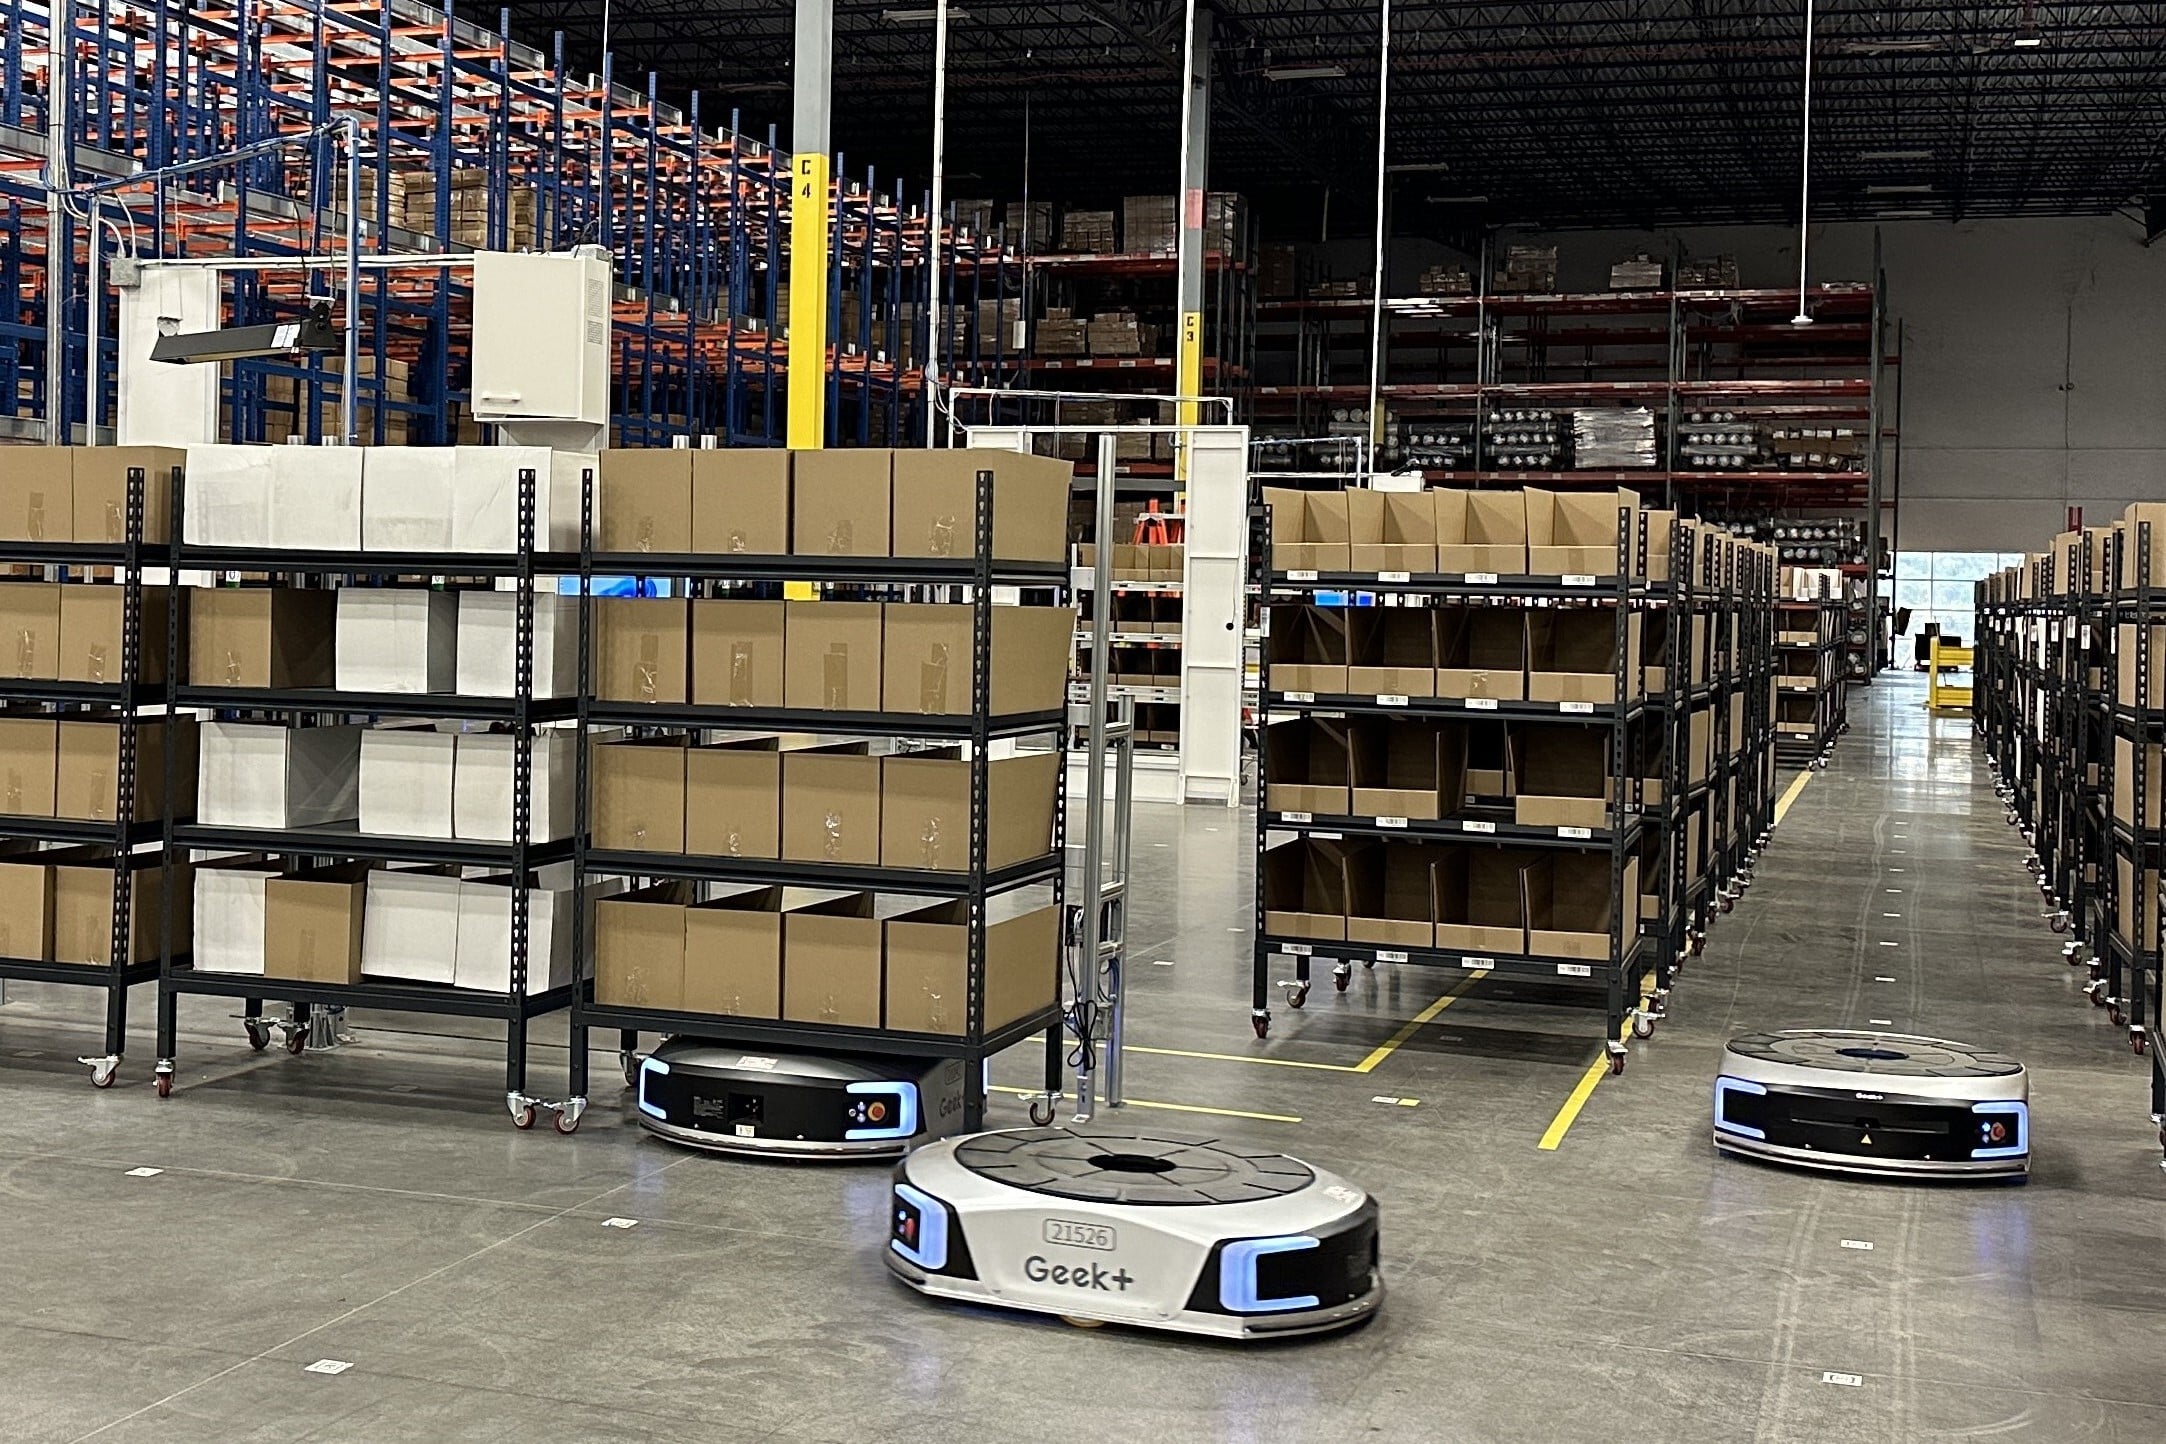
AMR shelf-to-person systems can flex more easily to accommodate spikes in SKU velocity. They support not only small items on shelves, but also pallets on AMRs as well as different shelf configurations. That flexibility makes shelf-to-person a strong fit for a wider range of SKU profiles. The primary consideration is ensuring accurate slotting to keep product flow efficient.
Spikes in SKU Velocity & Bin-to-Person Solutions
Bin-to-person, cubic ASRS, and shuttle-based goods-to-person systems all face a similar challenge: everything must fit into a tote or bin. As SKU cube and velocity increase, that quickly becomes more difficult and expensive. For example, if an operation needs to move 20 cubic feet of product but averages only 2 cubic feet of utilization per tote, the number of totes required, along with the cost of the system, rises significantly.
That doesn’t mean these solutions won’t work, but it may mean certain SKUs should be fulfilled separately from these systems. High-cube, high-velocity products like paper goods are often poor fits because they consume too much storage space while also demanding high throughput.
Understanding Sensitivities (Why Systems Struggle)
Sensitivities occur when a solution becomes less efficient under certain operating conditions.
In many ways, goods-to-person systems are either storage-bound or rate-bound:
-
A storage-bound system is driven primarily by capacity constraints
-
A rate-bound system is driven by the throughput required to support operations
Most systems live somewhere in between but understanding which side you’re closer to helps clarify where sensitivities will show up first.
Just because technology is challenged by an operational characteristic (like a large SKU population) doesn’t mean it should automatically be disqualified. There are often ways to design around these constraints or accept trade-offs in exchange for other benefits. There is always an inflection point where the cost, complexity, or operational friction required to overcome a sensitivity outweighs the value the solution provides.
Examples:
Cubic ASRS tends to be sensitive to:
-
Poor Pareto distribution (too many mid-velocity SKUs)
-
Short order cycle times (limited ability to pre-pick or buffer work)
Shelf-to-person systems tend to be sensitive to:
-
Low SKU affinity (resulting in too many shelf presentations for single picks
Tote-based systems tend to be sensitive to:
- High-cube items (inefficient cube utilization or poor fit)
why there's no one-size-fits-all solution
Every system has a “breaking point.” Different technologies best fit different conditions:
AMR Person-to-Goods
-
Flexible
-
Suffers with large SKU populations (too much walking)
Shelf-to-Person
-
Great with high SKU affinity
-
Struggles when orders are unpredictable or low affinity
Cubic ASRS (AutoStore-style systems)
-
High density, high efficiency
-
Sensitive to SKU pareto
Shuttle Systems
-
Best for extreme scale (high SKU count + high velocity)
-
Most complex and capital-intensive
The key takeaway is that each solution has strengths and sensitivities. Our industry often speaks in generalities even though operations are nuanced and unique.
Work with somebody that can help guide you through the data collection, business metrics, and operations. If you don't talk about those things up front, early and often, you are not set up to pick a technology that's going to meet your goals. It is about having a business discussion - not just feeds and speeds.
Avoid costly automation mistakes. Start with the right ingredients for successful outcomes.
Many fulfillment operations invest in automation before fully understanding the constraints they're trying to solve. Order profiles, SKU velocity, storage density, and service levels all impact which technology delivers the best ROI. Learn what to measure before making your next automation decision. Trew's Recipe Guide for Warehouse Automation Success explains how to evaluate goods-to-person systems based on operational data.