











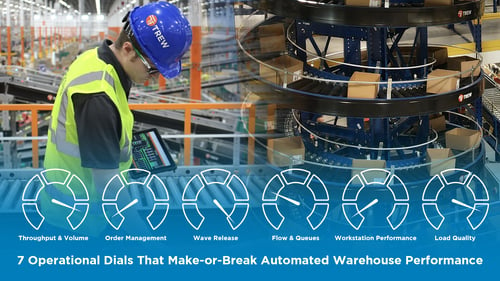
Automation struggles when real-world operations drift beyond the conditions it was engineered to handle. Understanding how these operational changes influence performance helps teams recognize early warning signs, identify root causes, and apply practical adjustments that restore reliable, resilient fulfillment.
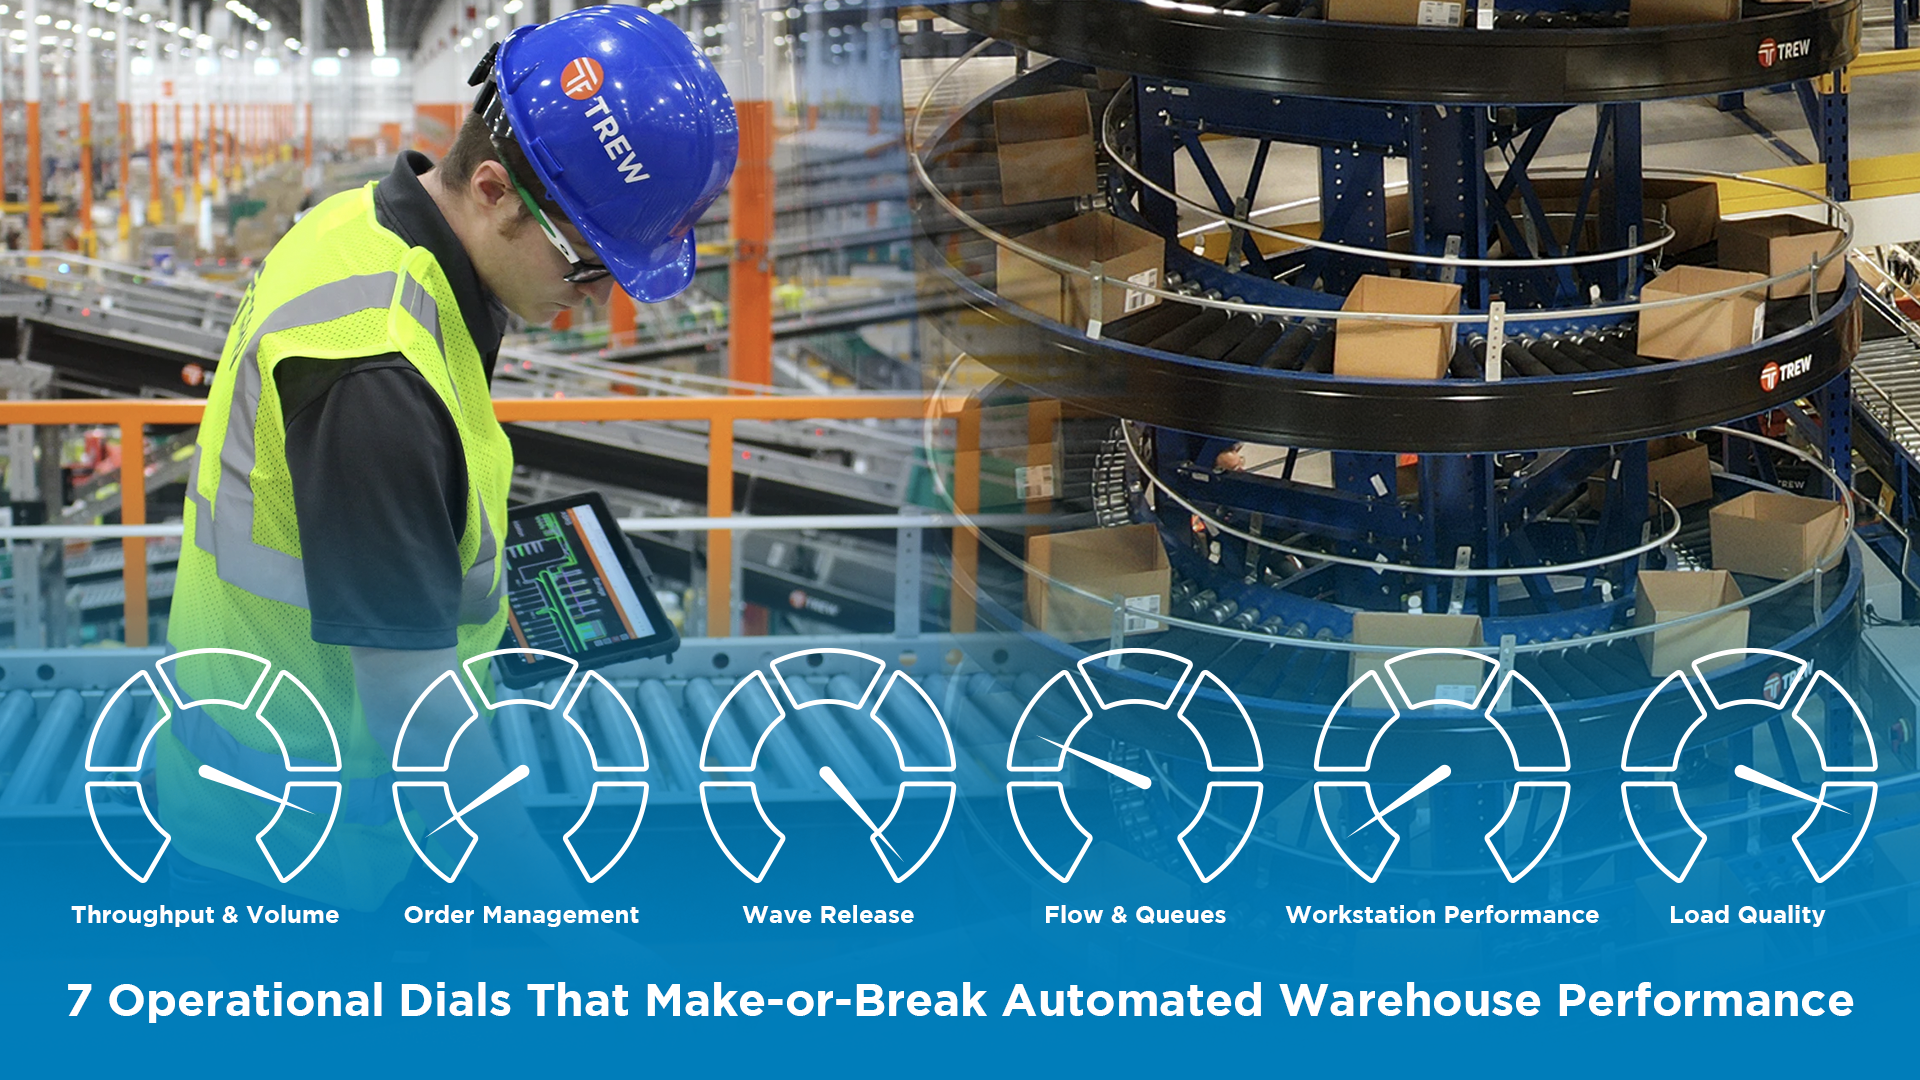
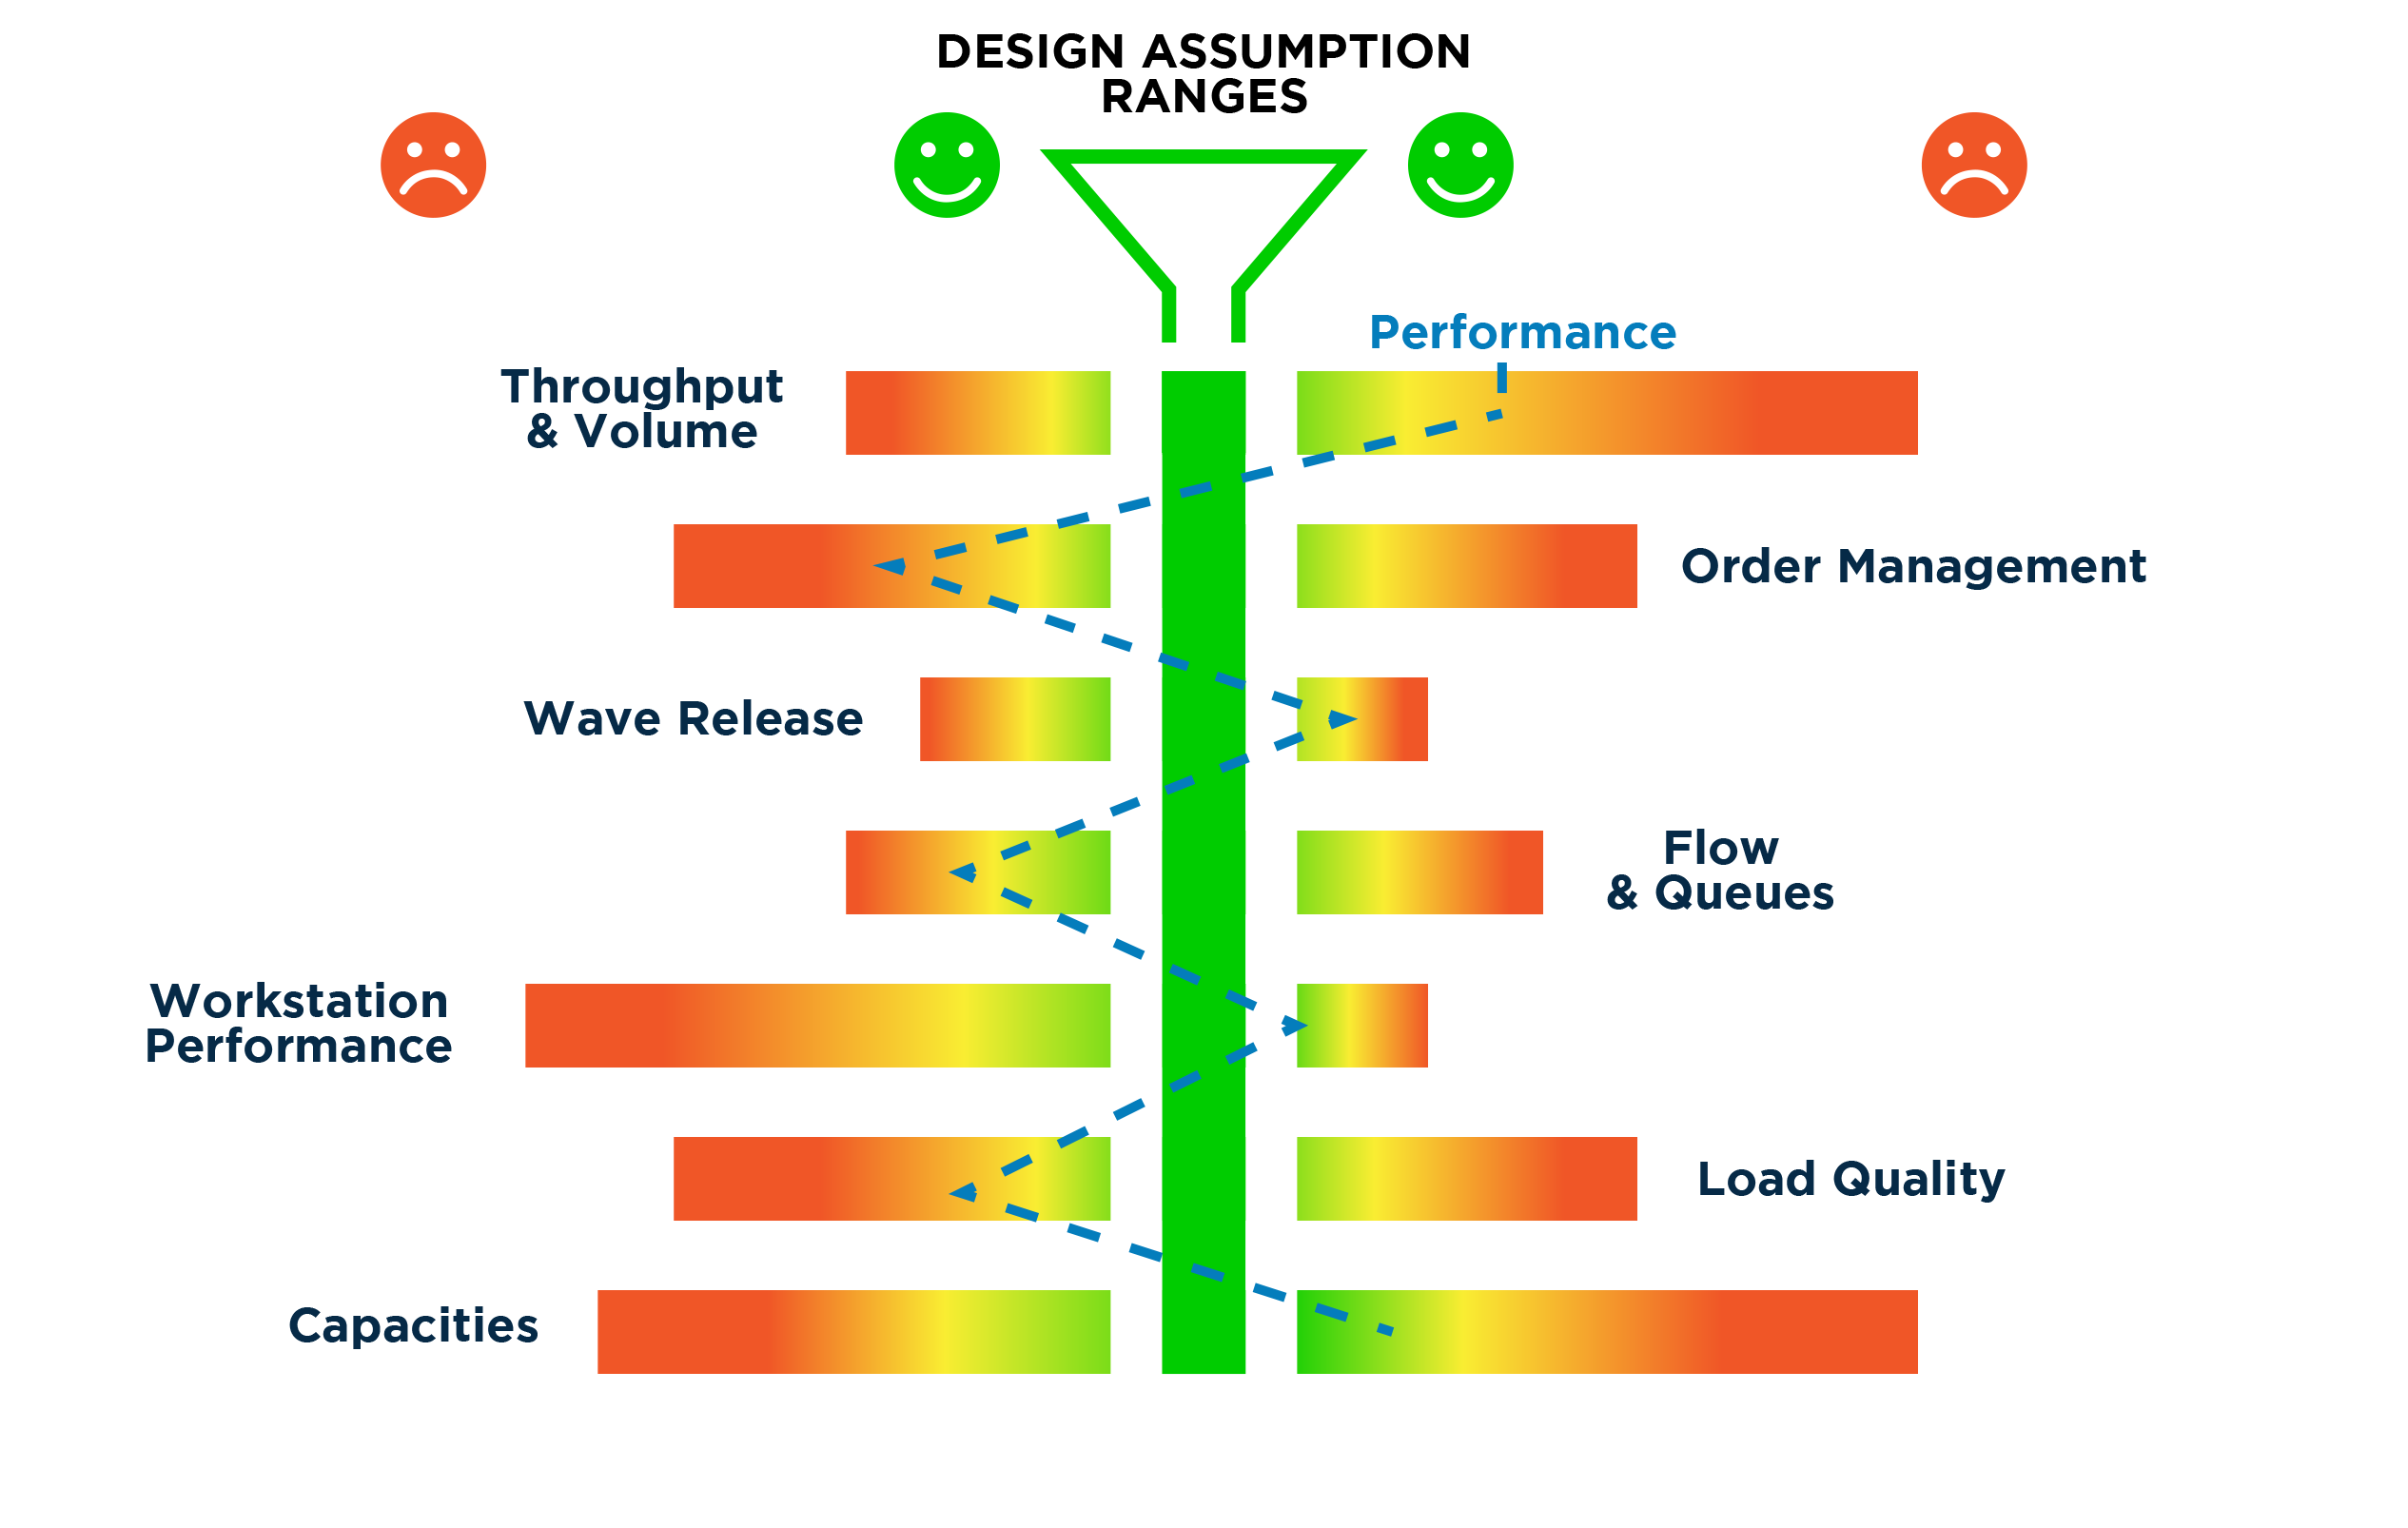
This guide explores how real-world operational drift impacts automation (conveyors, sorters, palletizers, G2P, etc.) and how to leverage seven “dials” to tune key operating conditions before performance drops.
Table of Contents
Why Sensitivities Matter
Automation is optimized for a defined operating range. No automated system can handle every situation. If it was designed to handle every condition and exception, nobody would be able to afford it. Thus, there has to be some constraints around the system design itself. Sensitivities occur when a solution becomes less efficient under certain operating conditions.
As conditions change (and they inevitably will) performance may degrade. The shift from center can happen gradually or rapidly. Even if performance temporarily increases, it will tend to reach an inflection point where it is detracting, rather than additive if conditions stay off-balance.
The goal is to be able to identify the impact of these sensitivities on system performance and understand how to get these conditions back on track.
The 7 Operational Dials That Make-or-Break Warehouse Performance
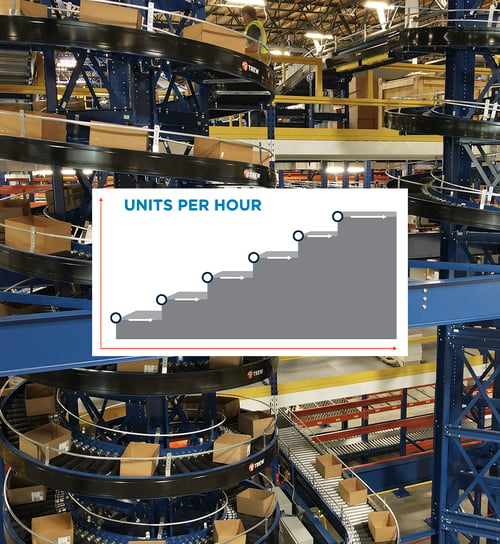 Throughput & volume
The first dial or sensitivity is throughput and volume.
-
Throughput: How fast the work gets done
-
Volume: How much work exists
Several properties influence system throughput and volume:
Order Profile
Order profile is the statistical makeup of customer orders. Changes in business models can affect order profiles. For example, a DTC retailer with mostly ecommerce profiles starts to sell wholesale to stores.
Key characteristics of order profile include:
-
Lines Per Order (LPO): The number of unique items/SKUs requested on the order. Operations typically have an average their systems are designed to handle (3 or 4). However, actual count can drift higher (5 or 6 per order) throughout the day. When LPO increases, order turnover slows because it takes additional retrievals to fulfill an order.
Lines per Order = Total Order Lines ÷Total Orders
-
Quantity Per Line: How many units of each SKU are ordered. When Quantity per Line increases, dwell time within the pick station can also increase as operators pick larger quantities of each SKU.
For example this order has:
-
-
-
-
3 lines per order (3 unique SKUs)
-
8 units per order (total quantity)
-
-
-
-
| SKU | Qty |
| Red Shirt | 2 |
| Blue Shirt | 1 |
| Socks | 5 |
-
Order Commonality: The degree to which the same SKUs appear across multiple orders. Higher order commonality can work to a system’s advantage by reducing the number of unique retrievals that must be made to fulfill multiple orders by picking multiple of the same SKU in batches. Whereas lower order commonality can slow units per hour out the door.
SKU Population
SKU Population represents the total number of SKUs in an operation.
In large SKU populations, operators may have to travel across a lot of SKUs that they do not need for a particular order, impacting travel time.
SKU Profile
SKU profile is the collection of characteristics that define an inventory population, including SKU count, SKU affinity, Pareto distribution, demand variability, and lifecycle behavior.
-
SKU Affinity: Measures how often different products (SKUs) are ordered together on the same order. For example, when someone orders coffee, they probably also order stirrers, coffee filters, and coffee cups. Shelf-to-person automation can be very effective in operations with high SKU affinity where SKUs that are ordered together can be stored on the same shelf and picking them requires fewer robotic presentations per order.
-
SKU Pareto Distribution: SKU Pareto describes the distribution of demand across a SKU population - showing what percentage of total unit movement is generated by what percentage of SKUs (for example, 80% of demand coming from 20% of SKUs). In cubic ASRS systems, a higher SKU pareto like 90-10 can be advantageous because more orders can be picked from the top of the grid, requiring less bin digging.
-
Demand Variability: The fluctuation in order volume, product demand, and operational workload caused by factors such as seasonal peaks, peak days, hourly surges, marketing promotions, unpredictable events, and changes in SKU or order mix.
-
Product Life Cycles: Describes how SKUs evolve from introduction and growth through maturity and obsolescence. A shorter SKU life cycle, like in high fashion, introduces difficulties as systems try to adjust to the high demand at entry point and subsequent waning as demand fades.
Staffing Models
Operations must account for staffing models, including things like:
-
Number of shifts
-
Break patterns
-
Staggering of shifts and break patterns to ensure continuous work
 order management
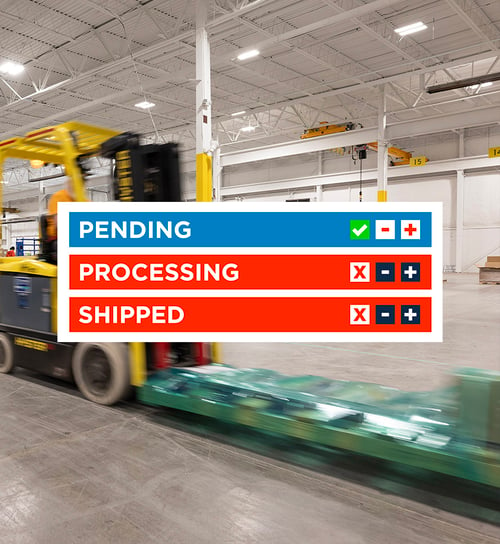
Order management is the process of routing and allocating orders across available inventory and fulfillment resources using real-time visibility, business rules, and order orchestration logic to deliver orders faster, more cost-effectively, and with the highest service levels.
Order Pool
Order pool is the number of orders available in the system.
-
Order Commonality: The extent to which the same SKUs are shared across multiple orders, creating opportunities for more efficient batch picking and order consolidation.
Order Grouping Logic
Whenever possible, there is an advantage to seeing all of the orders ahead of time. For example, having visibility into the next day’s orders provides more opportunities to identify SKU commonality and optimize order groupings. When the available order pool is limited to the next 15 or 30 minutes, those opportunities shrink, reducing efficiency for both inventory retrieval and operators at the workstation.
-
Cherry Picking (Batch Factoring): Measures how effectively orders can be grouped so a single presentation can satisfy multiple orders. Batch factoring is influenced by the size of the available order pool in a given window, SKU commonality within that pool, and distribution of orders across workstations. For example, 15 orders requiring the same SKU across 15 workstations provides little batching benefit, while those same 15 orders at one workstation could create a high batch factor. It is important to note that as high-commonality orders are fulfilled, the remaining order pool typically offers fewer batching opportunities.
Don't evaluate batching opportunities based on the entire dataset; evaluate them based on the orders that are actually available to be worked together at a given point in time.
-
Order Prioritization: The process of releasing and routing work based on factors such as order priority and carrier cut-off times.
-
SLAs & Timing: Often SLA’s will have order cutoff times at 3PM that must ship by 5PM for next day delivery. Tight delivery promises cause order groupings to become chaotic, losing similarity among those orders.
-
Route Stop Sequencing: Can fragment what looks like one large order pool into a series of smaller mini waves, reducing the effective batch factor. For example, even if many stores need the same SKU, route stop sequencing require orders to be processed in sequence by delivery route, creating smaller release groups and limiting batching opportunities.
 wave release
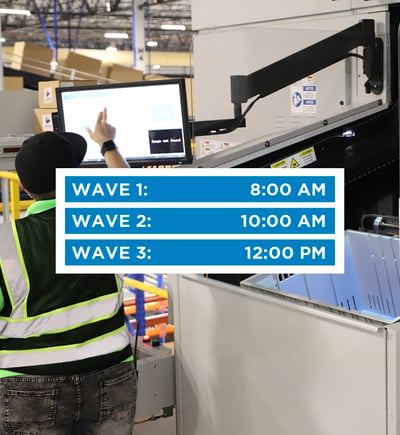
Wave release is the process of releasing a planned wave of orders into warehouse operations for execution.
Wave Timing
Wave release timing can have a significant impact on system performance. If a system is designed around hourly wave releases, each wave should ideally contain enough orders, lines, and units to keep the system productive for that full hour. When there isn’t enough work in the wave, the system may complete it in 15 or 30 minutes leaving idle time. Ideally, waves should be full as much as possible.
-
Wave Sizing & Release Frequency: Often dictated by service-level agreements (SLAs) and the size of the available order pool. Smaller order pools or tighter SLAs may require more frequent releases, but that can make it harder to maintain consistent system utilization. Understanding the tradeoff between efficiency vs cycle time and throughput is important when determining a wave strategy that supports both throughput and customer commitments.
-
Waveless Operations: Move fulfillment from rigid waves toward continuous flow, by releasing work in micro-batches based on demand, priorities, and available resources - creating a pull-system. Overlapping waves offer a practical middle ground for operations transitioning toward more continuous fulfillment.
Wave Types & Order Mix
Creating separate wave types for singles, multi-line orders, brands, customer types, or other categories can unintentionally fragment the order pool. Instead of evaluating the full order pool, the system is limited to the orders available within each wave. As wave types become more segmented, those smaller pools can reduce opportunities for optimization and ultimately degrade system performance.
Order mix further influences how effectively work can be grouped and released. Several characteristics can affect wave planning and system performance:
-
Complexity: Simple orders typically require fewer touches and less coordination, while complex orders may involve more SKUs, processes, or fulfillment steps. A higher concentration of complex orders can affect how much work can be efficiently grouped and released at one time.
-
Multi-line or Multi-quantity vs Single-line and Single Quantity: Single-line, single-quantity orders are relatively straightforward to fulfill. Multi-line or multi-quantity orders require more items to come together, increasing the importance of sequencing and coordination.
-
Heavy vs Light Items: Product characteristics can also dictate sequencing. Heavy items, for example, may need to be placed at the bottom of a carton or pallet before lighter products are added. These requirements can limit which items or orders can be released at a given time and reduce flexibility within the wave.
-
Special Handling: Orders requiring special handling such as unique packaging or hazmat labeling introduce additional constraints. These requirements may dictate when and how work is released, further reducing the system's ability to optimize solely around SKU commonality or order efficiency.
 Flows & queues
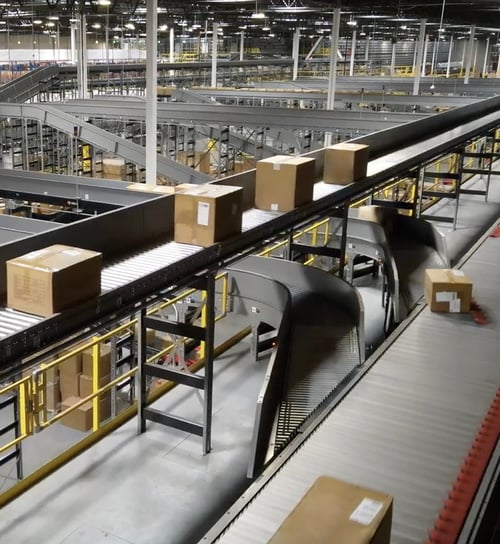
Flows and queues refer to material flow, operational flow, and work queues that are at or previous to any workstations.
Operational Cadence
Operational cadence establishes a consistent rhythm for working in fulfillment system. The goal is to align wave or batch sizes with a defined throughput target. Resource allocation also helps keep the operation on-pace as conditions change.
Resources can be reshuffled at regular intervals to address short-term needs, with periodic resets to bring the operation back to its target cadence. Different workflows may also require their own rhythms, such as separate cadences for Direct-to-Consumer (DTC) and store fulfillment operations.
Work Zone Imbalances
When wave or batch sizes vary significantly from one to the next, system performance can fluctuate with them. Some batches may be too large while others are too small, creating work zone imbalances and causing performance to oscillate. Keeping wave sizing relatively consistent from batch to batch helps stabilize workload and overall system performance.
Buffer Size, Trigger & Work Queues
Maintaining cadence also requires aligning buffer sizes and release triggers with work queue capacity and workstation performance. If a buffer is too small or work is released too slowly, a workstation can become starved. If work is released too quickly, the workstation can become flooded.
The goal is to balance buffer capacity, release triggers, work queue size, and workstation performance so each process receives the right amount of work at the right time. When these elements are coordinated with wave sizing and operational cadence, work can move through the system at a steadier, more sustainable rate.
Exception Volume
Exception volume is the quantity of operational problems requiring intervention. These can include:
-
No-reads
-
Inventory shortages
-
Hot replenishments
-
Damaged product
-
Mispicks
-
Order discrepancies
-
System-generated exception tasks
High exception volume is often a symptom of a deeper process issue. While some exceptions are inevitable, downstream impact and cost grows quickly when they aren’t caught early.
-
Time to Resolution (TTR): A critical measure of how quickly an operation can identify, address, and resolve exceptions before they impact throughput, labor efficiency, or customer service before they disrupt flow.
 Workstation Performance
Workstation performance spans far beyond the actual mechanical system in the real world. It also encompasses physical work content itself.
Physical Work Content
Physical work content is the portion of a task that requires human handling or manual interaction with equipment or products. It is often one of the first things analyzed when evaluating automation opportunities.
-
Direct vs Indirect Elements of Physical Work Content: In a warehouse or fulfillment environment this includes direct elements of physical work like picks per hour at a workstation and indirect elements like walking between picks, packing, bagging, and counting to confirm quantities.
-
Anthropometric Match to Workforce: Another consideration is the ergonomic match to the workforce from the workstation itself, so that operators have less fatigue and less delay while completing the work.
Operator Performance
Operator performance can be looked at on a scale of 0-100%. Where 100% would be someone working at peak performance. Most people are not physically able to operate at peak performance consistently for an entire shift, so when judging KPIs like pick rates, it is important to take performance variation into consideration.
For example, a goods-to-person picking station could transition 500 totes per hour mechanically, however true performance may look more like 300 picks per hour once human factors are considered.
-
Skill Levels: Operator skill level also influences overall performance including
- Quality of training
- Physical abilities
-
Training Ramp Up: The time and effort required for a new operator to achieve expected productivity, quality, and safety performance in an operation. A winning training approach includes:
-
-
Cross-train early
-
Target training to critical functions
-
Track performance from day one
-
Accelerate capable associates into higher-value roles quickly
-
Personal Fatigue & Delay (PF&D)
Personal Fatigue & Delay measures the operational impact of productivity losses that occur when operators become physically or mentally fatigued, creating slower task execution.
-
Performance Peaks & Valleys: Operator performance will typically be high in the morning and dip low just before breaks and lunches. After breaks, performance will trend higher again and wane towards the latter part of the shift.
-
Duration Degradation: It is expected that operator performance will degrade over the course of day as they become fatigued.
-
Personal Breaks: In addition to the effect of fatigue on operator performance, things like personal breaks, talking, eating, and drinking at the work area can also cause delays.
 load quality
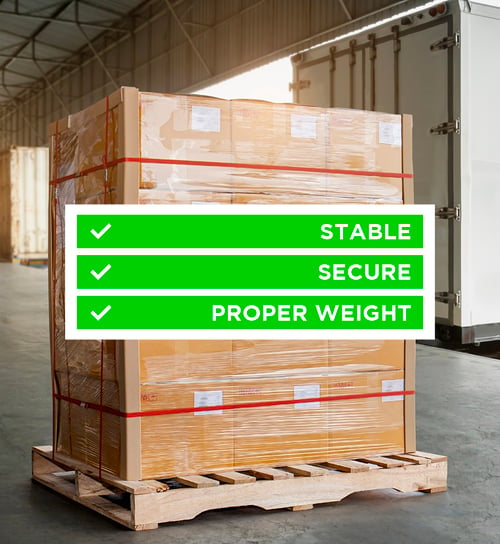
Whether it’s a pallet or container, a lot goes into load quality. Changes in those variables directly impact system performance.
Item Characteristics
Key item characteristics to account for in fulfillment operations include:
-
Size
- Fragility
- Shape
- Machinability
For example, if an ASRS cannot accommodate cartons under six inches, a wave containing a high percentage of undersized cartons will require more manual handling.
Size, shape, fragility, and other item characteristics ultimately determine how machinable a workload is. If a wave contains more items outside the automation’s operating constraints, more work must be handled manually, ultimately reducing overall system performance.
Carton & Packaging Integrity
Damaged cartons and crushed packaging create cost, waste, and customer dissatisfaction - ultimately negatively impacting performance. Product protection is a key design goal for automated systems. To ensure proper handling, look at:
-
Crush Strength
-
Packaging Material
-
Carton Stability
Pallet Integrity
Likewise, when designing for pallet integrity it is important to account for:
-
Stackable Height
-
Wrap Quality
-
Load Stability
-
Pallet Quality
An unstable load or damaged pallet entering a unit-load ASRS may require the system to stop for manual intervention, introducing dwell time. Differences in stackable height can also affect storage availability and utilization; a 20-inch load and a 60-inch load place very different demands on the storage structure.
Container Friction & Weight
Container friction and weight influence how effectively loads move through automation. A sticky package that does not transfer easily or a 60-pound container in a system designed for a maximum of 50 pounds may need to be handled outside the automation. When these conditions occur more frequently than expected, operations may need additional manual resources to maintain performance.
Label Quality
Poor label visibility, inconsistent placement, and unreadable barcodes increase manual touches and reduce routing accuracy. Automated print-and-apply removes variability from the labeling process, helping ensure labels are readable, properly positioned, and ready for reliable scanning throughout the fulfillment journey.
 capacities
System capacity is the rate at which a fulfillment system can process work.
Days-on-Hand and Replenishment Frequency
Often capacity of a system is determined by days on hand of inventory that is put into forward pick. This directly reflects the replenishment frequency.
-
Inventory Depth: The quantity of units available for a given SKU. For example, if the system holds three days of inventory on hand, roughly one-third of the SKU population may need to be replenished each day. Increasing inventory depth to five or seven days can reduce replenishment frequency, but it also requires more storage capacity. The key is to balance the size of the automation and the operation’s replenishment cost and frequency.
-
Out- of-Stocks: Lower inventory depth can also increase the risk of out-of-stocks. If a forward pick area is designed to minimize excess inventory, demand fluctuations or delayed replenishment can leave the system without the product it needs to complete an order. When that happens, orders are delayed until inventory is replenished. Capacity planning should consider not only how much inventory fits in the system, but how much is needed to keep fulfillment moving consistently.
Container Utilization (Inbound & Outbound)
Capacity can also change as product characteristics and container utilization shift. Consider a buffer feeding a unit sorter that was designed around totes carrying eight to 12 units. During winter, bulky coats may reduce that to four units per tote compared with smaller items like shorts and socks. The number of units per tote affects the total number of units in the buffer - the buffer then affects the hourly rate of a unit sorter. These physical characteristics are important capacity dials.
Pallet Configuration
Pallet configuration plays an important role in system capacity. Variations in vendor pallet configurations determine how much product can be stored and handled within a given footprint - affecting storage utilization and replenishment requirements. These characteristics are important to account for when sizing automation:
-
Pallet dimensions
-
Shape
-
Type: Euro, Chap, etc,
-
TI-HI: Number of cases per layer and layers per pallet
Automation Equilibrium
Every automated warehouse system operates in a state of equilibrium - a balance between storage capacity and throughput. The chart above references goods-to-person systems specifically. As SKU populations increase, more storage is required. As order velocity increases, more workstations are needed to keep pace. The relationship between these two factors determines how efficiently the system performs.
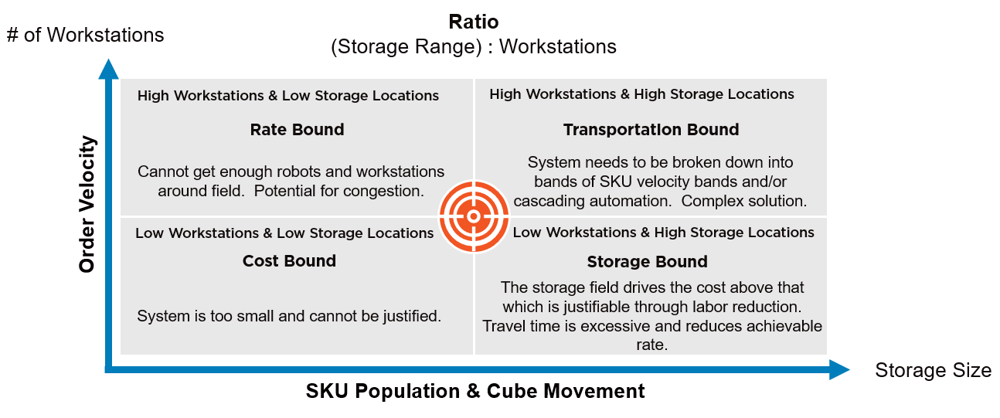
Example: Goods-to-person automation equilibrium)
When that balance shifts too far in one direction, performance suffers:
-
Rate Bound: Too many workstations with too little storage creates congestion as robots, shuttles, or conveyors struggle to keep up with demand.
-
Cost Bound: Too little storage and too few workstations make the system difficult to justify economically because there isn't enough volume to support the investment.
-
Transportation Bound: Large storage systems combined with many workstations increase travel distances, often requiring more complex software and material flow strategies to maintain throughput.
-
Storage Bound: Large storage capacity with too few workstations underutilizes the system, making the investment difficult to justify through labor savings or throughput gains.
The goal is to find the equilibrium point where storage capacity and workstation count are properly balanced for the operation's SKU profile and order volume. That's where automation delivers its highest efficiency, throughput, and return on investment.
Solutions Fit Approach
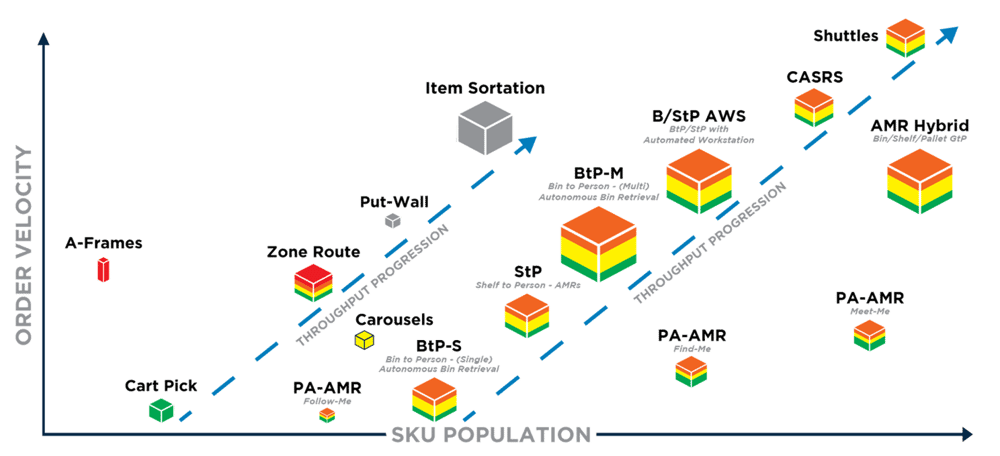
The graphic below shows a solution fit heuristic indicating that based on order velocities, SKU populations, item characteristics - every solution has a range of conditions it fits.
Conducting a rigorous fit analysis and throughput calculations before investing can prevent mistakes. The solution must be applied to the operation, order profiles, SKU profiles, and specific needs. The right automation should be selected based on real-world data and operational realities, not by forcing operations to fit into a chosen technology.
basic questions for Operations Leaders to ask
-
How does the variation in sensitivities by hour and by day affect the design?
-
Are orders visible and timed such to allow look-ahead optimization?
-
Can waves be timed and mixed to meet operational cadence?
-
How much variability of flow can the automation absorb?
-
Are human productivity projections realistic?
-
Do physical inputs meet automation specs?
-
Is inventory positioned to sustain flow and minimize operational cost?
Next steps to fine-tune automated warehouse performance
-
Baseline your current state against each sensitivity before selecting automation.
-
Stress test designs with worst-case, not average, profiles.
-
Build in flexibility: buffers, algorithm tunability, modular capacity.
- Monitor continuously post-go-live; sensitivities shift as the business evolves.
Experiencing performance drift as volumes, order profiles, or fulfillment demands change?
Trew helps operations identify hidden automation sensitivities, fine-tune system performance, and build resilience for whatever comes next. Contact our team to start the conversation.
let's connect