Getting to the End Zone with Post Peak Season Review
2024 brought us several notable trends. US retail sales grew 3.8% for the holiday season with last minute purchases representing 10% of the total holiday consumer spend says, Retail Dive¹
20% of holiday sales were generated through social media platforms, $195B of holiday sales were conducted on mobile devices, and retailer discount rates reached 23% says, Salesforce²
While retailers continue to smooth the holiday seasonal volume, these trends, and others like them continue to bring challenges to distribution and fulfillment operations with unpredictable spikes in volume and sporadic SKU demand. To overcome these holiday season challenges, leaders had to be creative and think on their feet with operational know-how. Now, in the first quarter of 2025, it's time to get back to the proven fundamentals.
There is no better time for an operation to accurately and effectively reflect upon its performance than following peak season when the daily execution wins and losses are fresh in mind. An intentional Post Peak Season Review proactively diagnoses what happened and defines quantitative plans for the new year with the primary purpose of improving your distribution/fulfillment operation faster than the competition so that you build competitive strength.

10 Steps to Conduct a Post-Peak Season Review
The following describes ten basic steps to conduct an effective Post Peak Season Review that will accelerate your operational performance:
-
INSPIRE your team’s review with a mantra. Develop a simple three-word mantra that explains why your operation exists. The purpose of the mantra is to unite everyone under a single transforming direction for the operation. Done well, a mantra can be a contagious and powerful means of inspiration.
-
IDENTIFY an operational champion that can make decisions and surround them with key resources such as functional area leaders, associates, equipment suppliers, maintenance, and software providers.
-
COLLECT quantitative data for each functional area regarding safety, quality, utilization, cycle time, throughput, mechanical reliability/uptime, and total cost per unit to process. Be careful to select metrics that are aligned with the overall performance goals of the operation.
-
EXAMINE each functional area methodically and map the processes using the data collected to answer three fundamental questions. Why is this “touch” or “process” performed and what does it do for the customer (internal and external)? How well did it work during peak and will it meet next year’s peak? How much of the processes time and cost is spent resolving exceptions and why do the exceptions occur?
-
BENCHMARK - During the assessment, the recently completed Peak Season performance should be benchmarked to the measured improvement over the previous year, “like-kind” processes or similar operations, actual performance to target KPIs, and actual to theoretical capacity.
-
SCORE the results of the information gathered. Purge any anomalies and use the meaningful information to score the results based on how well the process/operation will meet what’s ahead next year, both planned and predicted. SKU growth, shortened service levels, volume growth, and targeted KPIs such as cost per order are some of what is commonly planned while labor shortages, downtime events, and marketing campaigns/consumer trends are examples of what operations should be including in their plans as predictive measures.
-
LEAD - The results of the scoring should leave a clear path towards the direction of changes to be implemented whether they are procedural, mechanical, or logical. The action items usually involve increasing speed, enlarging capacities, and reducing errors. Don’t forget to include a few key subjective evaluations based on the flexibility to adjust during operations, the ability to sustain flow, time to recovery, and intuitiveness of problem resolution.
-
BE INTENTIONAL - To achieve meaningful results that will accelerate your operational performance, it is essential to be consistent across the operation, be open and honest with the information, be clear about the intent of the review, connect the direction to the data, empower the team to take action, and be committed to drive improvement.
-
CONTROL - Before launching your plan, it is important to determine the best metrics used to track improvements and how well they are positioning the operation to meet the targets for the next peak season. When choosing KPI’s to monitor, it is critical to understand the difference between leading indicators and lagging indicators. Lagging indicators are most familiar. They measure the output based on historical data and tell us what happened and are reactionary.
Leading indicators are based on input. While sometimes difficult to measure, when done so in real time, leading indicators are easier to influence preemptively.
An example of a lagging indicator would be the number of orders shipped per hour. Historical, and nothing you can do to change what happened. An example of leading indicator would be the fill percent on forward pick slots and the mean time to replenish. These are behaviors, that if caught quickly, can change the outcome for orders shipped per hour.
-
OPTIMIZE - Be quick to not only adopt but to optimize what is working well. And, as the leading indicators suggest, be even quicker to change what is not meeting expectations.

How well did your operation get the orders into the End Zone?
End the Season Strong and Start the Next One Smarter
Studying play-by-play game footage and sport performance analytics doesn’t end when the football season is over. When the playoffs end, coaches, their staff, and players begin to ask themselves; What did we do well? What did we do poorly? What do we need to change? How can we be better? And what do we need to do to win next year?
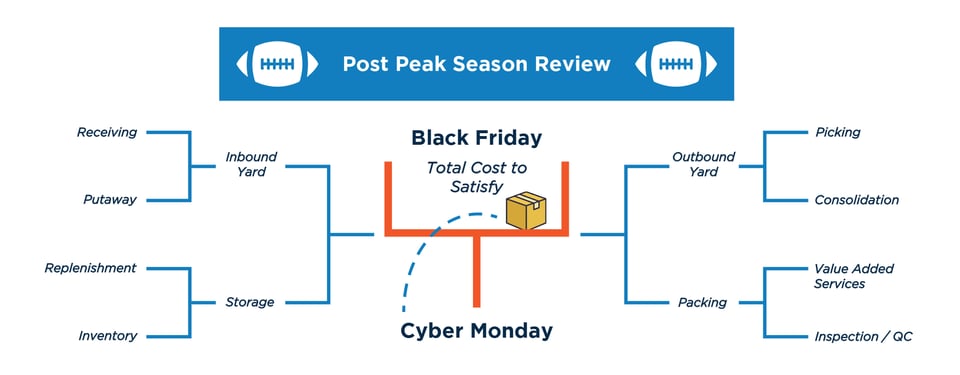
Regardless of end-of-season standings, it is critical that distribution/fulfillment leaders take the time to steer their team through an effective 360° review of their performance. From maintenance to metrics, studying last year’s performance will help you develop your winning strategies, grow the team, and improve the playbook tactics that will get customer orders into the end zone and through the uprights of the very best “total cost to satisfy.”
"If what you did yesterday seems big, you haven’t done anything today.” – Lou Holtz
In an industry of technology and automation, operational intuition and basic operational skills are still king. Now is the time to ensure that your team sheds the habits introduced out of the heat of holiday urgency and return to the solid fundamentals that will build the future of the operation by using these 10 basic steps to ground your team in skills that will prepare them for what lies ahead.
Editor's Note: This blog was originally published in January of 2022 and continues to be relevant today. The content was reviewed for updates before re-posting.
References:
- Retail Dive. (2025). US retail sales rose 3.8% this holiday season | Retail Dive. https://www.retaildive.com/news/us-retail-sales-rose-38-this-holiday-season/736544/
- Salesforce. (2025). 2024 holiday shopping data reveals shifting consumer behavior | Salesforce News. https://www.salesforce.com/news/press-releases/2025/01/06/2024-holiday-shopping-data/


